❔ The Four Steps
❔ Is there a visual way to think of our full 2-week analysis?
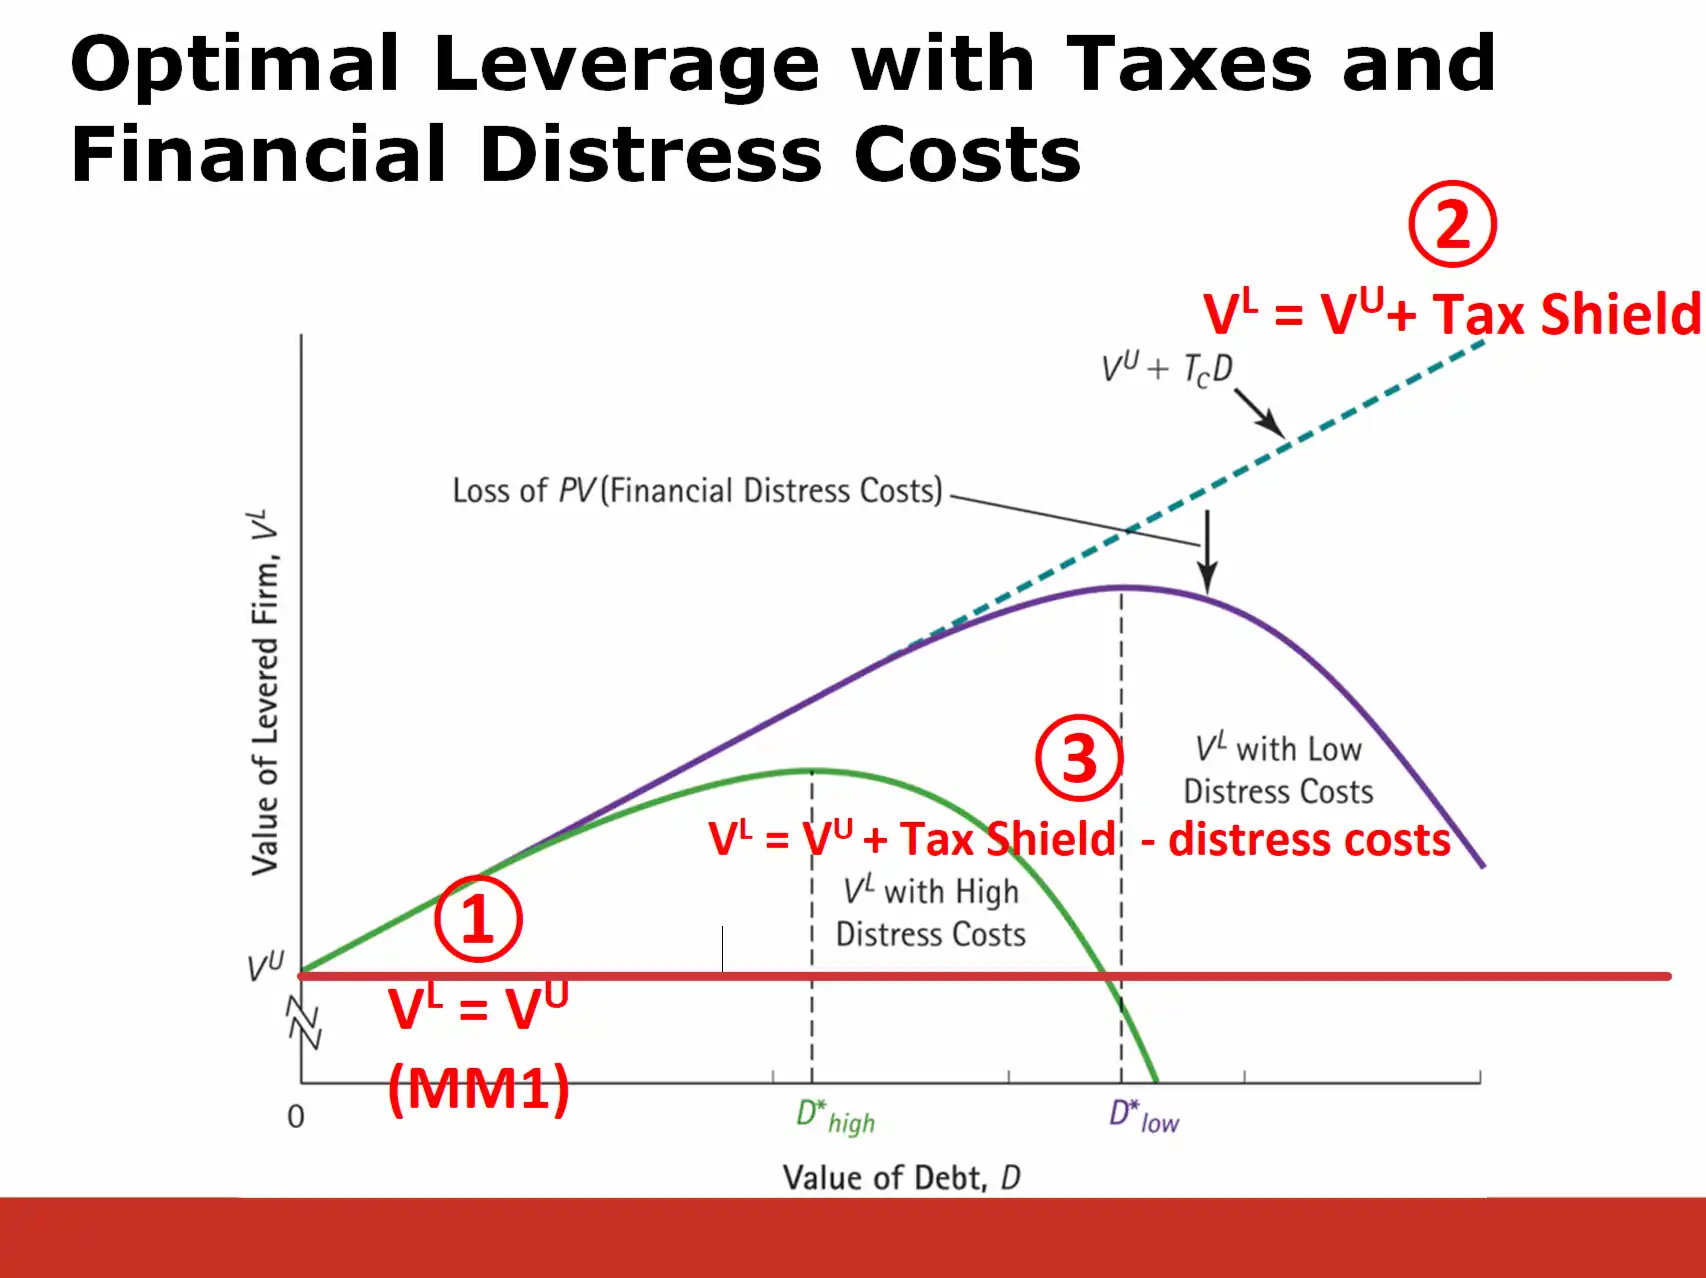
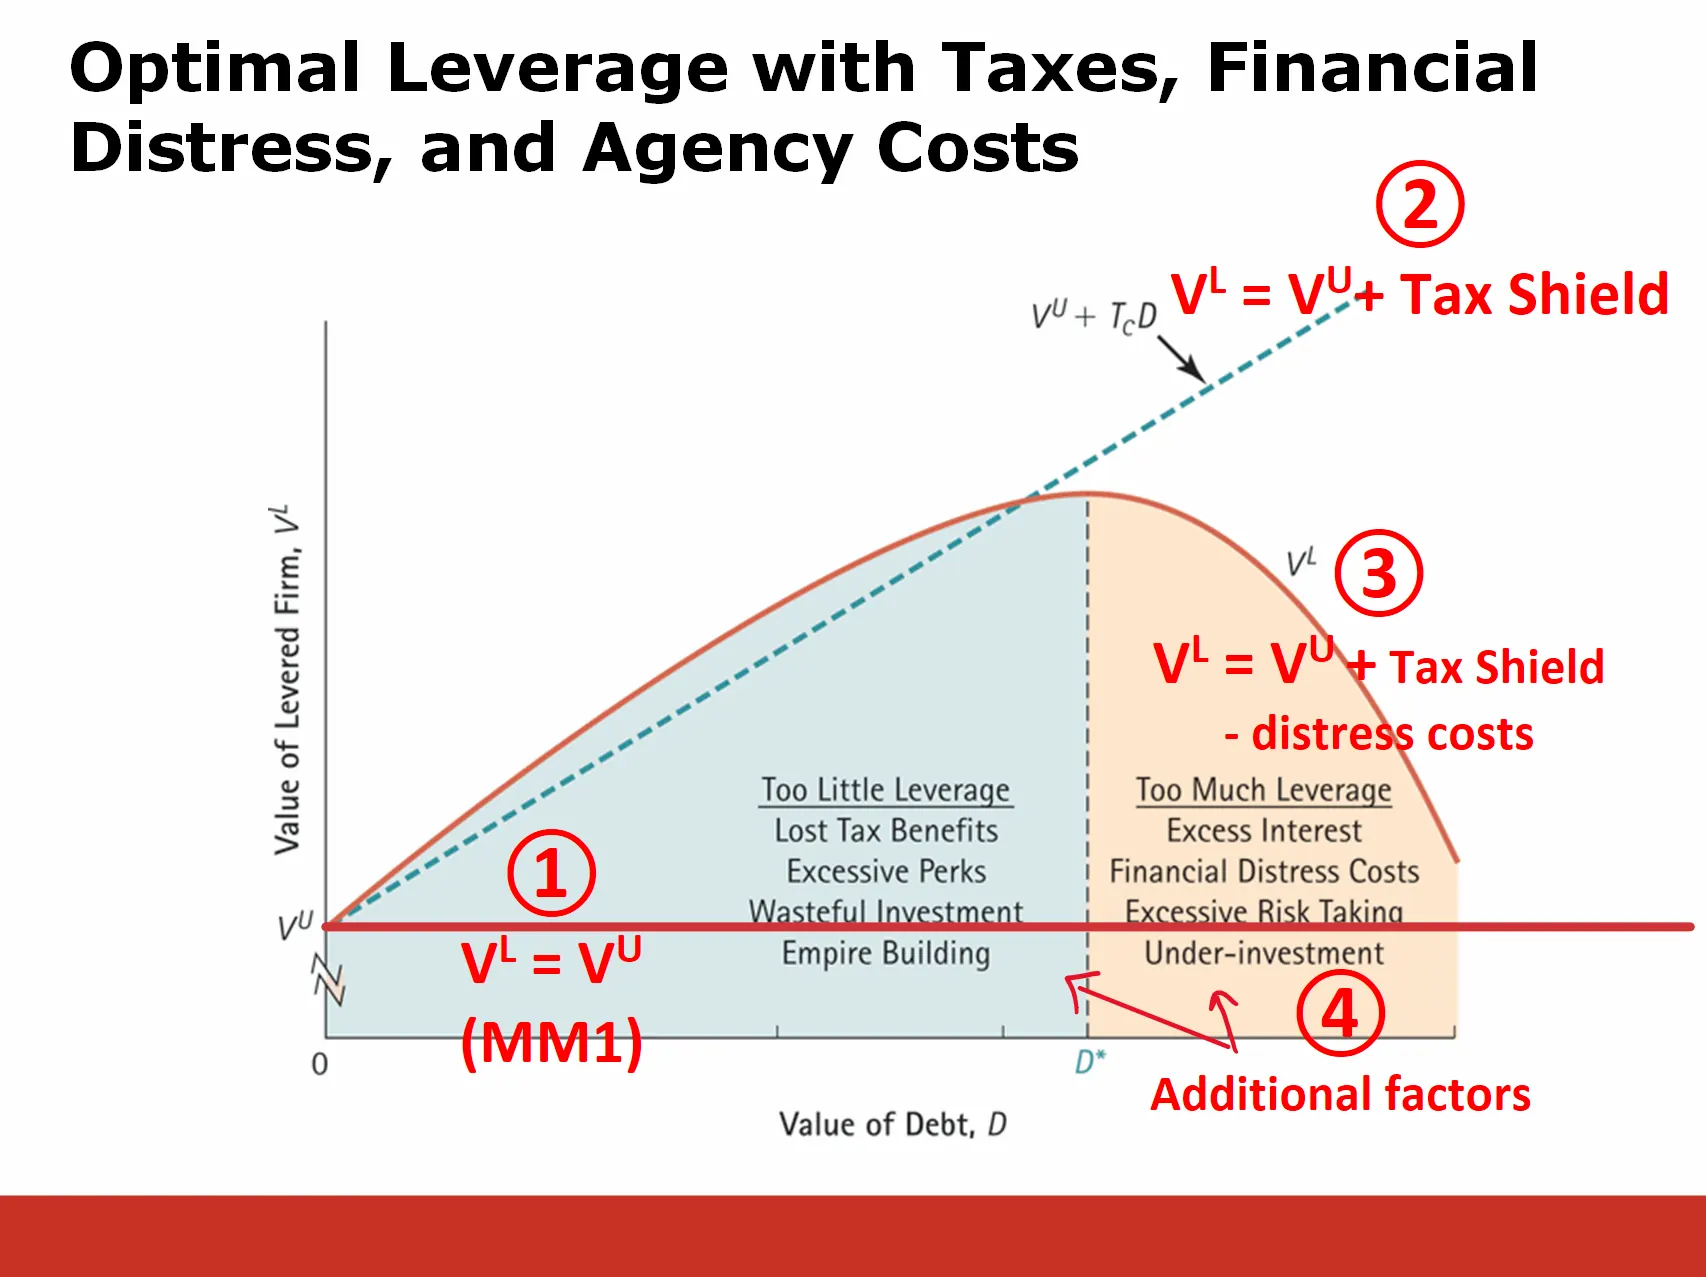
✔ I like to think of the Tradeoff theory as a 4 step process. These steps are highlighted in the diagram below:
Step 1: First, we see that under idealized circumstances, the value of a firm doesn’t depend on D. Specifically, MM1 tells us that for any level of D, VL=VU. This is indicated by the horizontal red line near the bottom of the diagram. We use MM1 as our baseline (both literally and figuratively)
Step 2: Next, we see that debt provides a tax shield that increases the value of the firm. The more debt, the better. This is indicated by the dotted bluish line that slopes up with more debt.
Step 3: Unfortunately, too much debt leads to distress costs, which cause the red line to slope downward.

In the remainder of the lecture, Bruce reviewed additional consequences of leverage, including Agency Costs and Information Asymmetries. We can think of these as a fourth step in determining D*:
Step 4: Factor in additional consequences of leverage related to Agency issues and Asymmetric Information
