🙋 Student Questions and Answers
Click here to learn about timestamps and my process for answering questions. Section agendas can be found here. Email office hour questions to robmgmte2700@gmail.com. PS1Q2=“Question 2 of Problem Set 1”

📅 Saturday, Mar 2
35 Questions
🕣 12:46
I reached out to Bruce about the length of the exam, and I’m happy to report that he decreased the number of questions in the draft year to 35 instead of 40.
Hidden camera video when he let me know:
Can you share some statistics from last year?

PS1Q8 - chained conversions
🕣 12:49
❔ I’ve been going through the problem sets to study for the midterm and I’m struggling with PS1 Q8. Are you able to go over this one in the next office hours?
❔ I just redid Problem Set 1 in preparation for the mid-term and found that I specifically struggled with Question 8. More specifically, I don’t understand how to calculate the debt for this scenario. Can you provide some further explanation please?
A company has a share price of $23.19 and 120 million shares outstanding. It’s market-to-book ratio is 4.2, it’s book debt- equity ratio (i.e., book debt / book equity) is 3.2, and it has cash of $850 million. Approximately how much would it cost to buy this business assuming you pay its enterprise value?
✔ We covered this in the video around 12:49 pm on Mar 2. The results are found in the first worksheet of the following spreadsheet: 3-2-24.xlsx.
Sensitivity Analysis vs. Scenario Analysis
🕣 2:25
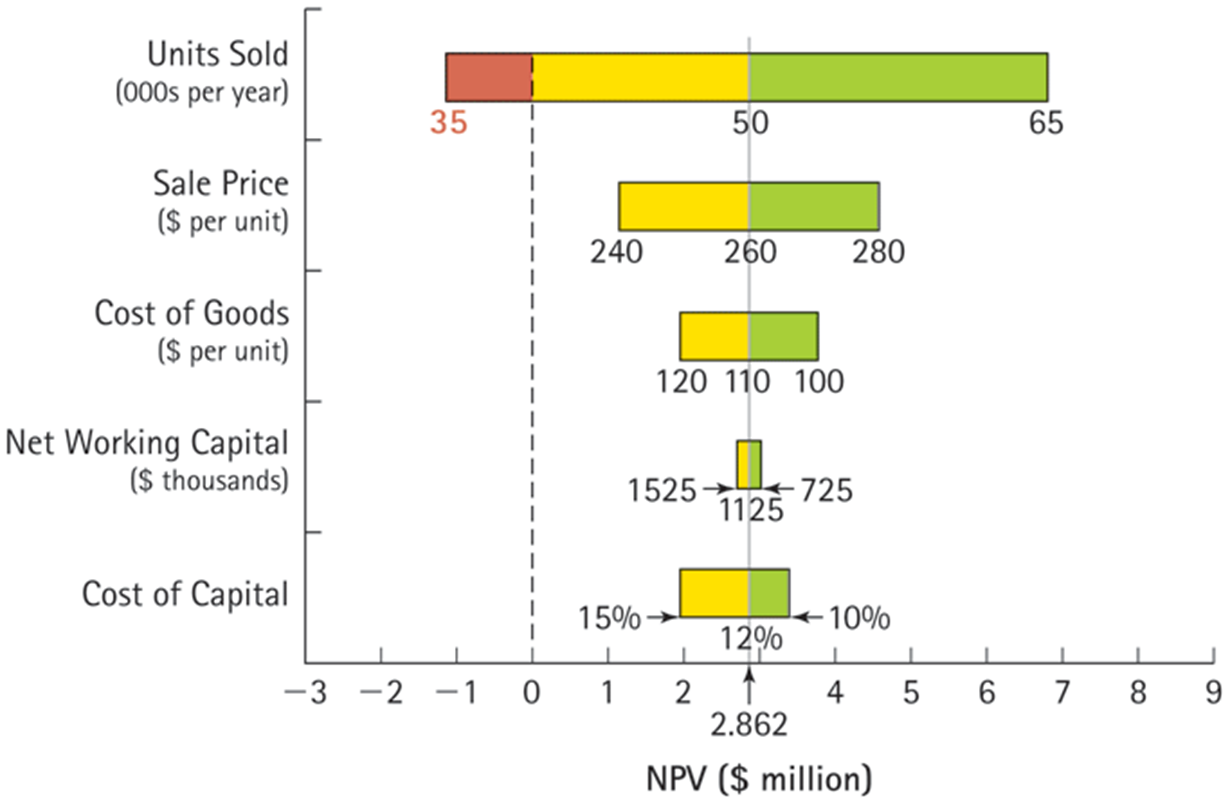
✔ In Sensitivity analysis, you’re only changing one fundamental assumption at a time. You can also look at a range of values for that assumption. For example, you can vary ‘#of units sold’ between 1m and 2m. For scenario analysis you dream up several scenarios. In different scenarios a wide variety of fundamental assumptions may be different. For example, in a recession , ‘#of units sold’ would be lower AND price might be lower, taxes may be lower, and HR expenses may be lower. When you investigate a scenario, many things may change.
For sensitivity analysis , the following graph can be helpful:

Break-Even Point
❔ is IRR the same as break-even point? What is the connection between break even point and NPV. Does it relate to other accounting data, such as EBIT, Earnings, etc.
✔ I think we clarified this when we covered the sensitivity analysis diagram, above. If not, please let me know!
Sensitivity analysis vs Scenario analysis
❔ Is Sensitivity analysis part of scenario analysis?
✔ In some sense yes.
Multiple monitors?
❔ Can we use multiple monitors?
✔ Unfortunately, Proctorio doesn’t support that.
📅 Monday, Mar 4
PS1Q8
🕣 7:53
✔ We covered this question on Saturday. Please scroll up to see the notes from then. We also briely re-covered this problem during the video. The recording from saturday contains a more detailed presentation at 12:49
PS2Q11
🕣 7:58
✔ in video
Real Options
🕣 8:04
❔ also, can you review the real options? I feel the lecture covers more ground than the book. Thanks!
Real Options
🕣 8:04
❔ also, can you review the real options? I feel the lecture covers more ground than the book. Thanks!
Accounting break-even point
🕣 8:09
❔ why the accounting break-even point does not account for the time value of money?
✔ Time value of money math adds a layer of complexity. Not only do you have to be familiar with the math, but you have to choose a discount rate. We will learn in the first class after the midterm how to choose our discount rate. However, some people prefer the system which is simpler. We will clearly prefer approaches which do account for the time value of money. We will consider these as superior.
PS4Q5
🕣
❔ Question 5
✔ discussed earlier when we covered the PS 4 Interpretation page.
PS4Q7
🕣
❔ Question 7
✔ discussed earlier when we covered the PS 4 Interpretation page.
Spring Break Sections
🕣 8:18
❔ Will we have sections over Spring Break.
✔ No. We only have sections when there is new material. I’ll probably do a section to review solutions for the midterm after a week.
Accelerated Depreciation
🕣
❔ Would he do a question on Accelerated depreciaton.
✔ We reviewed the relevant section of the formula sheet.
📅 Tuesday, Mar 5
Q5
🕣 3:37 ❔ Question five dealt with the effects of changing a single variable (cost of raw materials). The correct answer is A, Scenario Analysis. I chose C, Sensitivity Analysis, based on the idea of one variable changing, even if there are multiple effects. Can you explain why the correct answer is A, Scenario Analysis? I think I missed the nuance to the question.
✔ Great question. To distinguish between different options, you want to identify the number of core modeling assumptions that you are changing. In our case, the key modeling assumptions are:
- cost of manufacturing the knives,
- the selling price of the knives, and
- the number of knives that will then be sold The cost of raw materials is the scenario that ties them all together. If you feel that this wasn’t clear enough, you can reach out to Bruce. It’s always good for him to get feedback from students.
Q7
🕣 3:39 ❔ The other question I have is from number seven on the problem set. I was thinking they might be most likely to use the option to delay, and see if the revised estimates come true. Since it’s a future event, there is still opportunity to capture the value of opening the new location. I understand why they definitely don’t want to expand, and why switching doesn’t fit. I’m just not sure abandoning is as good an option as delaying.
✔ I discussed this when covering solutions. The key is that if you have the option to delay, you don’t have the option to abandon. If it turns out that the revised estimates aren’t true, and you have delayed and now know that they are aren’t true, you won’t be able to take advantage of that because you won’t have the option to abandon. When the break even point leads to a negative NPV, as it does here, then you need the option to abandon.